English · PDF 176
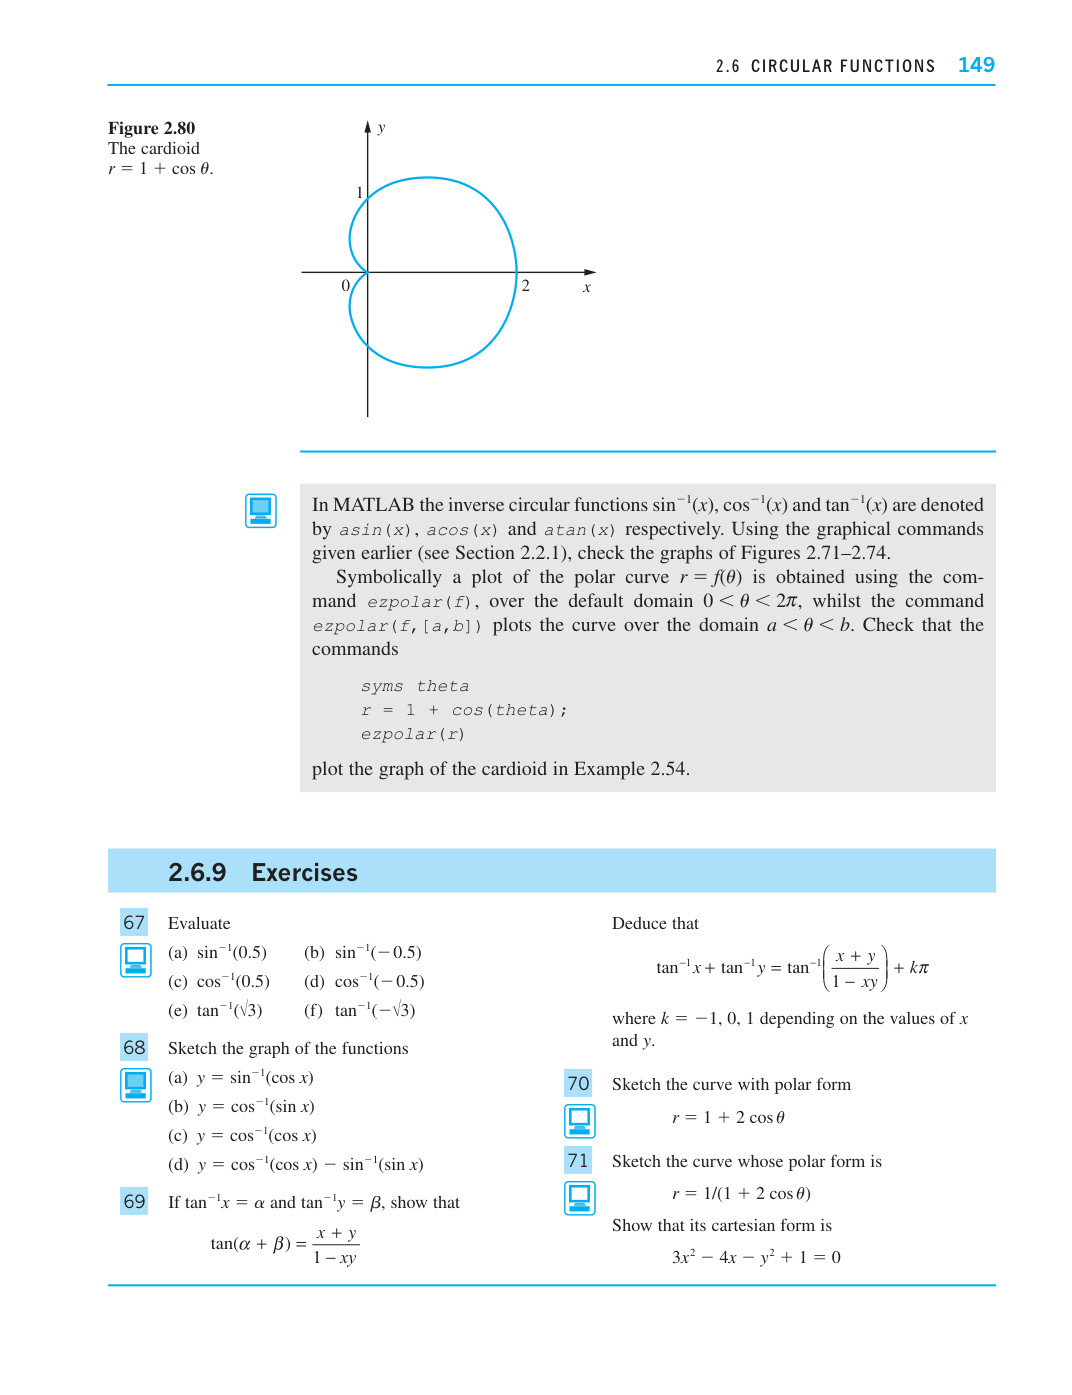
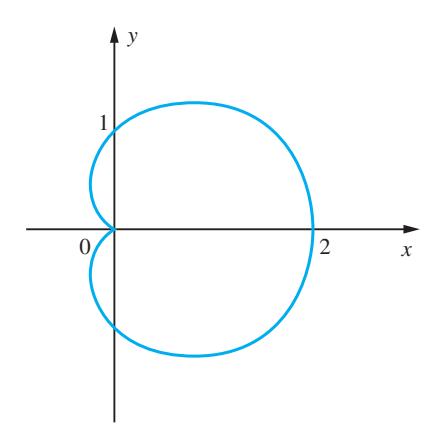

图 2.80
心脏线
$r = 1 + \cos \theta$ 。
在 MATLAB 中,反三角函数 $\sin^{-1}(x)$ , $\cos^{-1}(x)$ 和 $\tan^{-1}(x)$ 分别用 $asin(x)$ , $acos(x)$ 和 $atan(x)$ 表示。使用前面给出的绘图命令(见 2.2.1 节),检验图 2.71–2.74 的图形。
在符号计算中,极坐标曲线 $r = f(\theta)$ 的图形可使用命令 ezpolar(f) 在默认定义域 $0 < \theta < 2\pi$ 上绘制,而命令 ezpolar(f, [a,b]) 则在定义域 $a < \theta < b$ 上绘制该曲线。请验证命令
syms theta
r = 1 + cos(theta);
ezpolar(r)
绘制出例 2.54 中心脏线的图形。
67 计算

| 计算 | ||
|---|---|---|
| (a) $\sin^{-1}(0.5)$ | (b) $\sin^{-1}(-0.5)$ | (c) $\cos^{-1}(0.5)$ |
| (d) $\tan^{-1}(\sqrt{3})$ | (f) $\tan^{-1}(-\sqrt{3})$ | (e) $\tan^{-1}(\sqrt{3})$ |
68 画出下列函数的图像

69 若 $\tan^{-1}x = \alpha$ 且 $\tan^{-1}y = \beta$ ,证明
$$\tan(\alpha + \beta) = \frac{x + y}{1 - xy}$$
由此推出

$$\tan^{-1}x + \tan^{-1}y = \tan^{-1}\left(\frac{x+y}{1-xy}\right) + k\pi$$
其中 $k = -1, 0, 1$ 取决于 $x$ 的取值 $y$ 。
70 画出极坐标形式为的曲线

$$r = 1 + 2 \cos \theta$$
71 画出极坐标形式为的曲线

$$r = 1/(1 + 2 \cos \theta)$$
证明其直角坐标形式为
$$3x^2 - 4x - y^2 + 1 = 0$$